5.5 Unsupervised learning
On this page, an autoencoder can be designed in just a few steps. An autoencoder is a specially structured neural network with symmetric layers. It can learn to group input patterns according to similarity in an unsupervised manner. To do this, the symmetric neural network, with the same number of input and output neurons, is trained to output the input x again as output. For this reason, only the input data x is needed for training. In other words, there are no classes; instead, the neural network learns during training to output its input data again as output data or to reconstruct it as accurately as possible. Since the input data flows through the network in parallel and obviously little information is lost if it can be reconstructed almost completely at the end, it must have been automatically compressed in the middle of the network, where there are fewer neurons than in the input or output layer. This compressed representation of the data in the middle of the network is also referred to as the latent space.
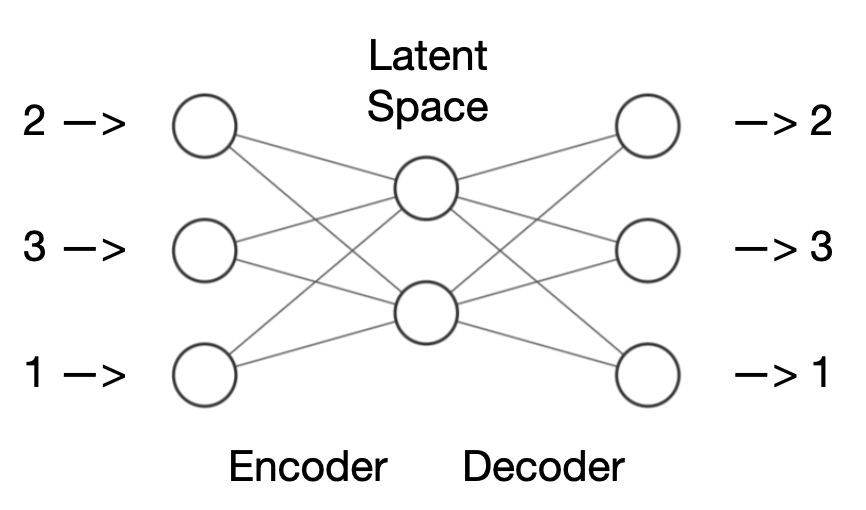
The figure above shows an example of a very small autoencoder network: there are three inputs and three outputs that form the frame. In between, there is a layer with two neurons.
The two areas to the right and left of the middle are referred to as the encoder and decoder. The encoder takes the input, in this case the numbers (2,3,1), and compresses it into a smaller representation, the latent space. This latent space contains a reduced version of the information from the input. The decoder then takes the latent space and attempts to restore the original numbers from it. The decoder unpacks the compressed information, so to speak, and generates a reconstruction of the original input. The interesting thing about this is that the autoencoder learns how to efficiently compress and restore information without being specifically trained to do so. This process is known as unsupervised learning.
1. Construction of the autoencoder
Before the network can be trained, the training data must be input into the appropriate field. The autoencoder is constructed automatically based on the recognised number of columns (maximum 8), and most settings are also determined automatically. To distinguish different types of input data from each other, you can select them line by line in the editor and assign a colour to them (there are examples below that illustrate the purpose behind this). The values of the weights and thresholds can be displayed at any time by hovering the mouse over them.
2. Training
The training data (input data only) must be entered separated by spaces or new lines, respectively. Input data has to be within the interval [0..1]. The learning rate is a value that typically ranges between 0.01 and 10.0. The greater the value, the faster but also less accurate is the training, and the greater are the weight and threshold values. The number of epochs determines the training length. An epoch is completed when all rows of training data have been used once for training. The network displays on a scale from blue (negative values) to red (positive values) how the weights and thresholds change over the course of training.
The input data can either be compressed into two values or alternatively into a single value. In the first case, the distribution of the compressed input data can be displayed in a two-dimensional coordinate system, and in the second case, on a single line. For this purpose, the outputs of the middle neuron/neurons are used as x- or y-axis values. At the same time, the numerical values for the middle layer and the output layer are displayed below the figure at all times.
3. Test
The use of (new) test data is optional and can be carried out afterwards. Simply replace the training data with test data. However, it should be noted that the test data must also be entered separated from each other by spaces or new lines and has to be within the interval [0..1]. When you click on Test, the representation of the input data in the latent space is overlaid on the coordinate system, and the output is displayed accordingly.
Example data
In the following, different example data can be loaded to train an autoencoder for demonstration purposes. To try out the examples, click the respective button and then click on the New & Train button above to see how the network is trained and how it can reconstruct the learnt training data from the compressed latent space. The examples are intended to illustrate how autoencoders can compress data (known as dimensionality reduction) and how autoencoders can be used to predict anomalies and for reconstruction. As is common with neural networks, training may not always succeed. In such cases, reloading the network or experimenting with learning rates and epochs might help improve results.
(1) The first example is an absolute . It shows very nicely how two input values are compressed into a single value and later unfolded back into two output values. During this process, the neural network “squeezes” the two-dimensional space spanned by the values x1 and x2 onto a one-dimensional line in between, similar to the minimal example using colours. In that case, the order between the colours is maintained at all times.
(2) The next example contains the coordinates of a three-dimensional whose front left bottom corner is at (0,0,0) and whose rear right top corner is at (1,1,1). During training, it is interesting to observe how the originally three-dimensional coordinates are “squeezed” into two dimensions and the neural network tries to keep the distance between the points as large as possible. This is because the eight points have no similarity to each other. Incidentally, the small network is not particularly good at fully restoring the three values of each pattern.
(3) The following uses eight patterns with low numerical combinations (black) and eight patterns with high number combinations (green). In this example, it is worth typing in your own numerical combinations afterwards, such as 1.0 1.0 1.0 1.0, and clicking on Test. This allows you to observe how similar numerical combinations (as seen in all examples) are projected into similar regions of the coordinate system.
(4) One commonly used data set, consisting of 150 input patterns (one pattern per line), lists information on . These are the measured values in centimetres for 150 different iris flowers (lilies), namely the sepal length, sepal width, petal length and petal width of the flower. These four values were collected for 50 Iris setosa (in red), 50 Iris versicolor (in green) and 50 Iris virginica (in blue), and divided by 10 so that they fall within the value range [0..1]. The colour coding of the input data allows us to identify the position of the three different flower classes in the latent space during training. It becomes evident that the three flower types form three nearly separate groups, also known as clusters. This also shows the advantage of dimension reduction to two values: it would not have been possible to visualise such a cluster formation with the original measurements with four features.
(5) Autoencoders can be used not only for dimension reduction but also for reconstructing lost data. For example, (significantly larger and more complex) autoencoders can be used to restore missing parts of images. An autoencoder that has been trained with enough image data will fill these missing areas with suitable content. Let’s illustrate this with a simple example.
With one click, data can be loaded that contains eight numbers per line, corresponding approximately to a (mathematical) from 0.2 to 0.9. After training the autoencoder, you can load in which the middle value is missing or has simply been replaced by 0.0 or 1.0. By clicking Test, you can send the two test lines with the wrong value in the middle through the neural network and observe how the missing part is replaced by a suitable value for the reconstruction of the values in the output window o. An autoencoder can do this because it only learned suitable data during its training and was never trained with values such as 0.0 or 1.0 at the missing point of the straight line.
(6) The previous example can be taken even further as autoencoders can also be used to detect anomalies in data. Let’s consider a scenario where there are four sensors measuring a person's temperature, pulse, blood sugar and oxygen saturation. Let’s assume, many measurements have already been recorded that are known to contain normal values. In, we can load this normal data (as a minimal example, only four rows here) and use it to train an autoencoder. (Note: The values were divided by 100 so that they fall within the interval [0..1]).
After training, you can now load test data in and click Test to pass the data through the autoencoder. The example data contains two normal measurements (in green), one measurement with increased temperature and increased pulse (in red), and one measurement with high blood sugar levels (also in red).
Next, in, you can automatically or manually calculate the difference between the input data and the reconstructed output data for each row. The first two measurements should result in values close to 0, since they represent normal data. However, the last two values should be significantly higher, as they represent deviations from the normal range. The autoencoder was unable to fully reconstruct these data points because it was trained only on normal data. As a final step, you could incorporate a threshold to trigger a warning from the autoencoder when it detects data that is outside the normal range.
Share this page

