Adopt a Tree - Voltage is Everywhere

Overview
Overview
Keywords: Ecology, environmental engineering, plant biology, automation
Disciplines: Physics, chemistry, biology
Age level of the students: 10-15
Time frame: 45 - 90 minutes per activity (measurements could take longer)
![]()
![]()
![]()
Introduction to DC voltage measurements
The DC voltage measurement is used to determine the difference in electrical potential between two points in a direct current circuit.
Voltage is what makes electric charges move and it is also called, in certain circumstances, electromotive force (EMF).
The positive terminal of a battery is higher in electric potential than the negative terminal by an amount that is equal to the battery voltage. Batteries produce direct current (DC) as this current always flows in the same direction between their two terminals, marked as positive (+) and negative (-). In a closed circuit, electrons move from the negative terminal to the positive battery terminal.
A voltmeter is used for measuring the voltage (electrical potential difference) between two points in a circuit and it is always connected parallel to those points. There are two types of voltmeters, analogue and digital, with the voltage being measured in volts.
Work for students
Students watch the "Introduction to DC voltage measurements" video and then:
- collect batteries of different types
- measure the voltage at their ends using a multimeter
- compare the displayed voltage to the nominal one and discuss the possible reasons for any difference between them
- change the scale in the DC voltage section, thus becoming familiar with the different way of displaying the same voltage
- Although the positive and the negative terminals are usually measured with the corresponding probes of the voltmeter, students can also check that when they are switched, a negative voltage will be displayed.
- they open and run the «Voltage explained» H5P file.

Plant voltage
Hooking nails to plants or trees and connecting a voltmeter, the generation of a steady voltage of up to a few hundred millivolts is observed.
A battery is a device that stores chemical energy and converts it to electrical energy. A part of the battery possesses an excess of electrons, and another part a lack of electrons. As like charges repel, the excess electrons want to go to the other side and that generates a voltage. Voltage can cause charges to move, and since moving charges are a current, voltage can cause a current.
Trees and plants in general seem capable of providing a constant voltage of anywhere between 20 and a few 100 millivolts – way below the 1.5 volts from a standard AA battery and close to the level of background electrical noise in circuits. Nevertheless, the voltage between a standing tree and its surrounding soil is regarded as an innovative renewable energy source. [1], [2], [3], [4]
Work for students
Students watch the "Plant voltage" video and then:
- Replicate the set-up with a plant of their choice and a multimeter
- Place one end of a multimeter deep in the soil of the plant pot while the other in the stem of a leaf and record the indication of the voltage after it has stabilised
- Without removing the ends of the multimeter, they keep monitoring and recording the plant voltage at different times of the day and night and try to correlate the acquired data with the respective temperature and humidity values.
A low cost "data logger"
A data logger based on the monitoring of plant voltage with reference to ambient light intensity, temperature, and humidity.
Data logging is the process of collecting and storing data over a period of time and it involves tracking a variety of events. While data logging, in general, is associated with devices, even looking at a thermometer daily at a set time and writing down the temperature on a piece of paper with a pen is an undeveloped way of "logging data".
The advantages of data logging include the automation of data collection so no human presence is necessary, the fact that readings can be continually taken over long periods day and night, and the elimination of the chance of somebody forgetting to take a reading. A data logger is an electronic device with a microprocessor, various sensors and a memory. The stored data is then manually transferred to a computer for assessment and analysis. Despite the usefulness of data loggers, their occasional complexity and high price might be deterrent to their use.
Work for students
Students watch “A low cost ‘data logger’ “ video which describes how a web camera and time lapse software can work together to provide a basic data logging scheme. As every taken frame carries a timestamp, it is easy for the students to match the time points with the values of the data displayed in the photos and use them to create tables and charts (see graph below).
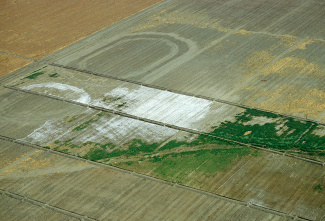
Climate change drives soil salinisation in several ways. First, ocean temperatures are rising, and warmer sea water takes up more space. Climate change also causes heat stress, which will deplete groundwater resources and increase saline contamination of soils inland (image: Southern California). This ever-increasing soil salinity is playing a major role in forest decline and long-lived tree species die over time due to higher salinity. Nevertheless, the extent to which coastal forests can regenerate is still unclear. [5]

Soil salinisation, aerial view of fields in central California
Authors of Adopt a Tree: Astrinos Tsoutsoudakis (GR), Corina Toma (RO), Iro Koliakou (GR)
Links to forward to your students
Trees could be the ultimate in green power. (9th March 2022). New Scientist.
Zhibin Hao, Guozhu Wang, Wenbin Li, Junguo Zhang, Jiangming Kan, Effects of Electrode Material on the Voltage of a Tree-Based Energy Generator. 24th August 2015
Koppán, András & Fenyvesi, A. & Szarka, Laszlo & Wesztergom, V.. (2002). Measurement of electric potential difference on trees. 46. 37-38.
Koppan, A. (2004). Variations of the natural electric potential differences occurring on tree trunks and their relationships with the xylem sap flow.
Gibson, Nancy, et al. Southern Research Station General ... - Climatehubs.usda.gov. July 2021, https://www.climatehubs.usda.gov/sites/default/files/GTR-259_revd_web.pdf .
Image "Aerial view of fields in central California": public domain
Here we used the freeware Webcam Timelapse, but others are available.
Share this page

