Adopt a Tree - Internet of Trees

Overview
Overview
Keywords: Sustainable forestry, Arduino, sensors, IOT, climate change, remote sensing, ecology, environmental engineering
Disciplines: Physics, chemistry, biology, humanities, natural resources management, technology
Age level of the students: 15-18
Time frame: 1 school year (9 months)
Partners: Nearby schools
![]()
![]()
![]()

Building a green guard
A data logger based on the monitoring of plant voltage with reference to ambient light intensity, temperature and humidity.
Trees seem capable of providing a constant voltage of anywhere between 20 and a few 100 millivolts – way below the 1.5 volts from a standard AA battery and close to the level of background electrical noise in circuits. In the potato battery experiment, the energy comes from reduction and oxidation reactions eating into the electrodes, which are made of two different metals, usually copper and zinc.
In the case of trees, there is a current even with electrodes being made of the same material, meaning that another effect must be at work. This electricity possibly derives from a difference in pH between the tree and the soil, a chemical imbalance maintained by the tree’s metabolic processes.[1] Nevertheless, the voltage between a standing tree and its surrounding soil is regarded as an innovative renewable energy source.[2], [3].
Work for students
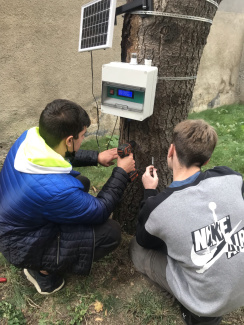
Students watch the Building a green guard and Wiring a tree videos which provide sufficient information on how to assemble, test, install and activate a microcontroller-based data logger. This data logger includes sensors for voltage, illuminance, temperature and humidity. It is powered by a rechargeable battery and stores all the collected data on a removable memory card to be retrieved at a later stage. The recorder is installed on an adopted tree, located in an urban area, in a nearby forest or even in the school yard.

Students are asked to analyse the collected data and identify possible relationships between the measured environmental parameters and the tree voltage, e.g., what happens to the voltage when the sun sets or the temperature rises. Due to the complex plant biology and our limited knowledge of the origin of the potential difference between a point of the trunk and the ground, possible attempts to interpret its size and sign should not be a target for this lesson plan. Besides, the voltage measurements obtained by using the recommended very simple set-up will differ from those of a multimeter at the same time. Explaining why this happens, is beyond the scope of this lesson plan and only voltage changes should really matter.
You will find more sensor programming information below in the teaching materials section with additional materials. Also, check out the Science Magic Box - From sensor to actuator.
Forest reader
A data logger based on the monitoring of plant sap temperature recovery time with reference to a series of environmental parameters.
Sustainable management and conservation of the world's forests was significantly stimulated at the UN Climate Change Conference (COP26), with financial commitments, technical progress and a statement by world leaders and other stakeholders on “Forests and Land Use”. Recent reports have painted a bleak picture of the state of the world's forests, with rising deforestation rates, more severe and frequent forest fires and damage from droughts and floods.
The following are essential:
- clear actions to preserve the crucial role of forests in strengthening resilience, reducing greenhouse gas emissions
- knowledge and tools to protect our forests and maintain the functions of their important ecosystems.
The FOREST READER addresses these goals. It was created to monitor air quality and pollution levels in parks or forests and also to assess the health of trees. We can use a single device attached to a tree or we can mount several separate devices if we want the measurements to correspond to a large area.
Work for students
Students built an electronic circuit which is based on an ATmega2560 microcontroller board, ARDUINO MEGA 2560, to which they attached a set of sensors, a 20x4 liquid crystal display, a sap tree module and a Wireless NodeMCU based on an ESP8266 WIFI Internet of Things development module. The last module purpose is to transfer data for recording and processing to the web server on our own site.
They used components that are easy to source, cheap, simple to interface with the Arduino board, with a low energy consumption (the device being autonomous), powered at low voltage and that provide the desired parameters.
The measured environmental parameters and their sensors are:
- Soil moisture - capacitive analogue sensor, DF-SEN 0193
- Air temperature, air humidity, air pressure, air quality (carbon dioxide and total volatile organic compounds CO2 + TVOC) sensor SEN 0335 (BME280+ CCS 811)
- Ambient light - analogue sensor SEN 0043 (TEMT6000).
The tree sap module is a device to detect if the sap is flowing through the trunk. Its components are:
- Pt100 RTD (Resistance Temperature Detector), inserted in a protective metal tube
- amplifier MAX31865 RTD PT100
- Optocoupler module with a relay (12 V coil powered) and
- Heating element of 7.5 W powered at 12 V (a soldering iron).
The module design is based on many articles about sap sensors but still remains original. [5], [6], [7], [8]
The operating mode for the tree sap module
Two holes (diameter 4 mm) must be made perpendicular to the tree, on the same part of the trunk, placed one above the other about 10 mm apart and both are about 40 mm deep. The heating element is inserted in the lower hole and the Pt100 resistance in the upper hole. Arduino Mega controls for 4 seconds the heating (from the power supply at 12 V) of the soldering iron, through a digital output, an optocoupler and a relay.
When the soldering iron heats up, so does the sap of the tree. The sap temperature signal is amplified by the MAX 31865 amplifier and then processed by the microcontroller and displayed. If the tree is alive, the warmer sap rises and reaches the RTD. After 4 seconds, the heating is stopped, the sap will start to cool, returning to normal temperature. The cycle repeats after 30 minutes. For the living tree, the temperature "pulses" last about 4 minutes but for the dry tree, the return to ambient temperature last about 10 minutes.
To work independently, the FOREST READER power supply is made with
- 10 W photoelectric cell, type CL-SM-10P
- Solar charge controller, type BK87455 - 20A, 2xUSB, 12/24V
The voltage controller charges a rechargeable gel battery, type UL 7-12 and at the same time supplies via USB the Arduino Mega with 5V and the heating element with 12V.
The values of the environmental parameters (soil humidity, air temperature, relative air humidity, air pressure, air quality – CO2 + TVOC, luminance of the ambient light and sap temperature) are displayed every 15 seconds on the liquid crystal display and transmitted wireless, via ESP 8266, to our own site for storing and plotting.
For coding we just used open-source Arduino software.
All the components have been mounted in a plastic box with a high degree of protection IP55, in order to be able to operate in harsh environmental conditions.


FOREST READER block diagram
|
Circuit |
Pin |
Provider |
Interface |
Arduino pin |
|---|---|---|---|---|
|
DF-SEN 0193 |
output |
DFROBOT |
analogue |
A6, analogue in |
|
DF-SEN0043 |
output |
DFROBOT |
analogue |
A7, analogue in |
|
DF-SEN0335 |
SCL |
DFROBOT |
I2C |
SCL |
|
SDA |
SDA |
|||
|
LCD display LCD2004 20x4 |
SCL |
eBay, Amazon |
I2C |
20/SCL |
|
SDA |
21/ SDA |
|||
|
MAX 31865 |
CS |
Adafruit |
SPI |
9 |
|
SDI |
10 |
|||
|
SDO |
11 |
|||
|
CLK |
12 |
|||
|
ESP 8266 |
Rx |
|
UART |
18 |
|
Tx |
19 |
|||
|
Optocoupler module |
1 2 |
|
- |
V+ 7 |
The data measured by the Forest Reader is visible on a liquid crystal display, with 4 rows of 20 characters each and stored in a memory card with a capacity of 8 gigabytes.
Two examples for graphs to interpret
The students can make a range of graphs to interpret this. In the first, you can see the consequence of a polluting car passing near the tree: the TVOC value increases at the same time as the CO2 concentration.
In the next figure, you can see that the rising illuminance causes the air temperature to increase from 6 °C to 17 °C during the day and this in turn influences the sap base temperature in the trunk. In the same time period, the sap base temperature varies from about 7 °C to about 11 °C. Remember that the sap temperature peaks are made by the heating element from the sensor.
Based on the data measured by the Forest Reader and by establishing minimum and maximum values of the measured parameters, in accordance with the specific conditions of the environment in which it is located, a number of decisions can be made, for example generating alarms in the case of:
- drought (air temperature ≥ 40 °C and soil moisture ≤ 30%),
- fire (air temperature ≥ 40 °C, high CO2 concentration),
- air pollution (TVOC and high CO2 concentration),
- floods (soil moisture ≥ 90%),
- dying of trees.
The Forest Reader is a very useful tool for those interested in protecting nature, trees in forests or urban parks, those who want to live in a clean environment without pollution.
The sensors used are of the latest generation, with low electric energy consumption in order to study the influence of environmental conditions on the long-term evolution of the tree.
The photovoltaic cell is mounted on a support that can be adjusted horizontally and has a variable inclination in the vertical plane, to capture the best possible sunlight. The support is fastened with two steel bands and screws on the tree.
Due to the harsh operating conditions, outdoors, over extended temperature and humidity ranges, all electronic assemblies are placed in a weather-resistant plastic box with a degree of mechanical protection IP 55.
Conclusions
The solution adopted by the members of the project group is unique and innovative in terms of:
- the use of last generation sensors, with low energy consumption
- the use of an original sap sensor
- the large number of parameters measured and monitored
- the high storage capacity of measured data on the website.
You should note that the device is mobile, and can be mounted in urban parks or forests, but also in isolated places and in harsh environments.
The FOREST READER is autonomous in terms of power supply and can be easily integrated into environmental monitoring systems, and this does not require additional costs.
Schools from different countries/areas could make such devices, work together by monitoring trees, share and compare their results. All their data could be collected in a database or on a website created for this purpose.
On the other hand, the schools could insert their findings on the school's websites to inform the community. In a smart city, air quality can only be improved by the presence of a proper green mass, i.e. healthy trees.
Authors of Adopt a Tree: Astrinos Tsoutsoudakis (GR), Corina Toma (RO), Iro Koliakou (GR)
Links to forward to your students
Gibson, Nancy, et al. Southern Research Station General ... - Climatehubs.usda.gov. July 2021, https://www.climatehubs.usda.gov/sites/default/files/GTR-259_revd_web.pdf
Hao, Zhibin & li, Wenbin & Kan, Jiangming & Jiang, Liyuan & Feng, Chao. (2013). Bioelectricity in Standing Trees - A Potential Energy For Wireless Sensor Networks. TELKOMNIKA Indonesian Journal of Electrical Engineering. 11. 10.11591/telkomnika.v11i8.3148.
Morat P, Le Mouël JL, Granier A. Electrical potential on a tree. CR Acad Sci. 1994;317: 98–101.
Steve Burgess, Alec Downey - SFM1 Sap Flow Meter manual, v. 5.1, ICT International Pty Ltd Australia, 2018.
David McJannet, Peter Fitch - A flexible and easily constructed heat pulse system for monitoring sap flow in trees, CSIRO Land and Water Technical Report no. 39/04, 2004.
P. Dangare, T. Mhizha, Design, fabrication and calibration of a low-cost smart sap flow measuring system based on ATmega 328/P microcontroller, EAI International Conference for Research, Innovation and Development for Africa, Proceedings, European Union Digital Library, 2018.
Brett Stoddard -Sap Flowmeter Build Guide, Open Lab Projects Archive, 2019.
Teaching Materials
Share this page